5. Agents
A series of tools to perform data manipulation and adaption.
5.1. Capping
Cap data to certain values.
5.1.1. CapAgent
Class for capping. The class can be instantiated without specific parameters. Arguments can be later specified with self.fit() method.
- resourcegeo.transformation.capping.CapAgent.fit(self, greater_than=None, less_than=None, cap_to=None, subset_col=None, subset_code=None)
Define required capping parameters.
- Parameters:
greater_than (float) – threshold value
less_than (float) – threshold value
cap_to (float) – capping value
subset_col (str) – column name in pd.DataFrame
subset_code (int) – categorical code
- Returns:
Class object with fitting parameters.
- Return type:
self
- resourcegeo.transformation.capping.CapAgent.fit_apply(self, data, var, suffix='_cap')
Cap values of values in a dataframe column. It requires the fitting parameters previously specified with self.fit(). It does not require and does not change initialized weights.
- Parameters:
data (pd.DataFrame) – df with values
var (str) – column name for values
- Returns:
None
- resourcegeo.transformation.capping.CapAgent.sensitivity(self, values=None, limit_value=None, weights=None, wt_col=None, chosen_value=None, show_progress=False)
Capping sensitivity analysis over a range of capping values.
- Parameters:
values (int or list[float], np.array(float)) – If int, it is the number of capping values for the sensitivity. If list or np.array, it is the values to use for sensitivity
limit_value (float) – If None and capping above a threshold, the limit value is the maximum value of uncapped data. If None and capping below a threshold, the limit value is minimum value of uncapped data. The limit_value can be also specified by the user.
weights (np.array) – weights for calculating statistics. It must be same length than the data.
wt_col (str) – column name in self.data for the weights.
chosen_value (float) – If value is not in values, it is added.
- Returns:
None
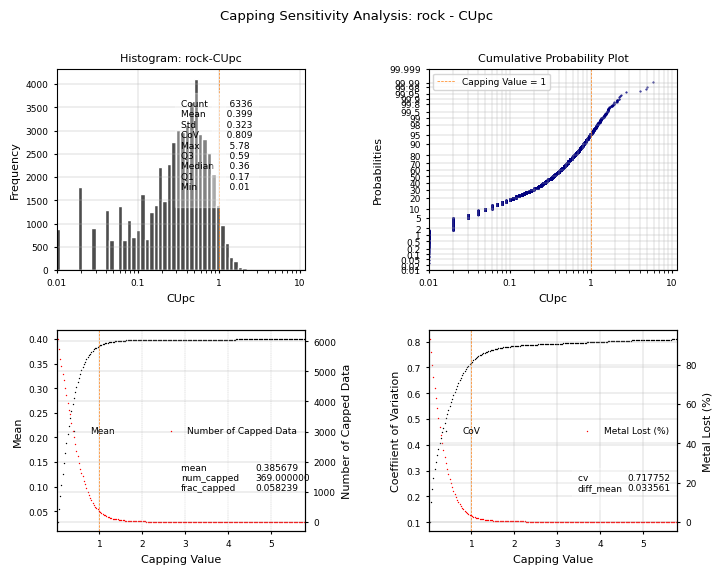
- resourcegeo.transformation.capping.CapAgent.sensitivity_plot(self, line_at=None, title=None, lw=0.5, figsize=None, xscale='log', sinch=(8, 6), fontsize=8, ms=1, nbins=None, flname=None)
Plot a set of four plots for capping sensitivity analysis. Plot a user defined vertical capping line in the graph and show the closest response to that value. If weights were used in sensitivity(), then the statistics in the histogram and the probability plot are weighted.
- Parameters:
line_at (float) – Value to plot a vertical line in the histogram and cdf subplots. If summary of the response is shown in the graph, it corresponds to the closest capping value to line_at
title (str,optional) – title of the graph
lw (float) – width of the vertical line plotted at line_at value
figsize (tuple(float,float)) – figure size
xscale (str) – x-scale ‘log’ or ‘linear’ for the histogram and cdf
fontsize (float) – font size
ms (float) – marker size for third and fourth subplot
nbins (int) – number of bins for the histogram
Examples:
import resourcegeo as rs
df = rs.BaseData('assay_geo').data
capped = rs.CapAgent().fit(greater_than=1,cap_to=1,subset_col='rock',subset_code='MXPRI')
capped.fit_apply(df,'CUpc')
capped.sensitivity(values=200, wt_col='ai')
capped.sensitivity_plot(line_at=1)
- resourcegeo.transformation.capping.CapAgent.unistats(self, weights=None, wt_col=None)
Obtain summary statistics of the capped values
- Parameters:
weights (np.array) – weights for calculating statistics. It must be same length than the data.
wt_col (str) – column name in self.data for the weights.