Signals present irregularities such as sudden drops, peaks or subtle shifts that break the pattern. These features mark important transitions wether the data represent financial markets, seismic data, geological scans and others. Detecting of these patterns requires precision and a correct analytical approach. Available algorithms are tailored to specific applications. Among them, change point detection and peak detection stand out. Though different in scale and focus, both aim to uncover hidden structure within the signal. Understanding when and how to apply each method is key to extracting meaningful insights. This post explores how signal irregularities reveal deeper truths and why choosing the right detection strategy can make all the difference.
Pruned Exact Linear Time (PELT) detects shifts in the mean level of a signal. It detects changepoints in time series data by minimizing a cost function that balances model fit and complexity. The complexity refers to the number of change points detected. It’s especially effective for identifying shifts in mean or variance. PELT uses dynamic programming with a clever pruning strategy to discard unlikely changepoint candidates, drastically reducing computation time. Unlike brute-force methods, it guarantees an exact solution while scaling linearly with data size under certain conditions. This makes it ideal for large datasets where speed and accuracy are crucial.

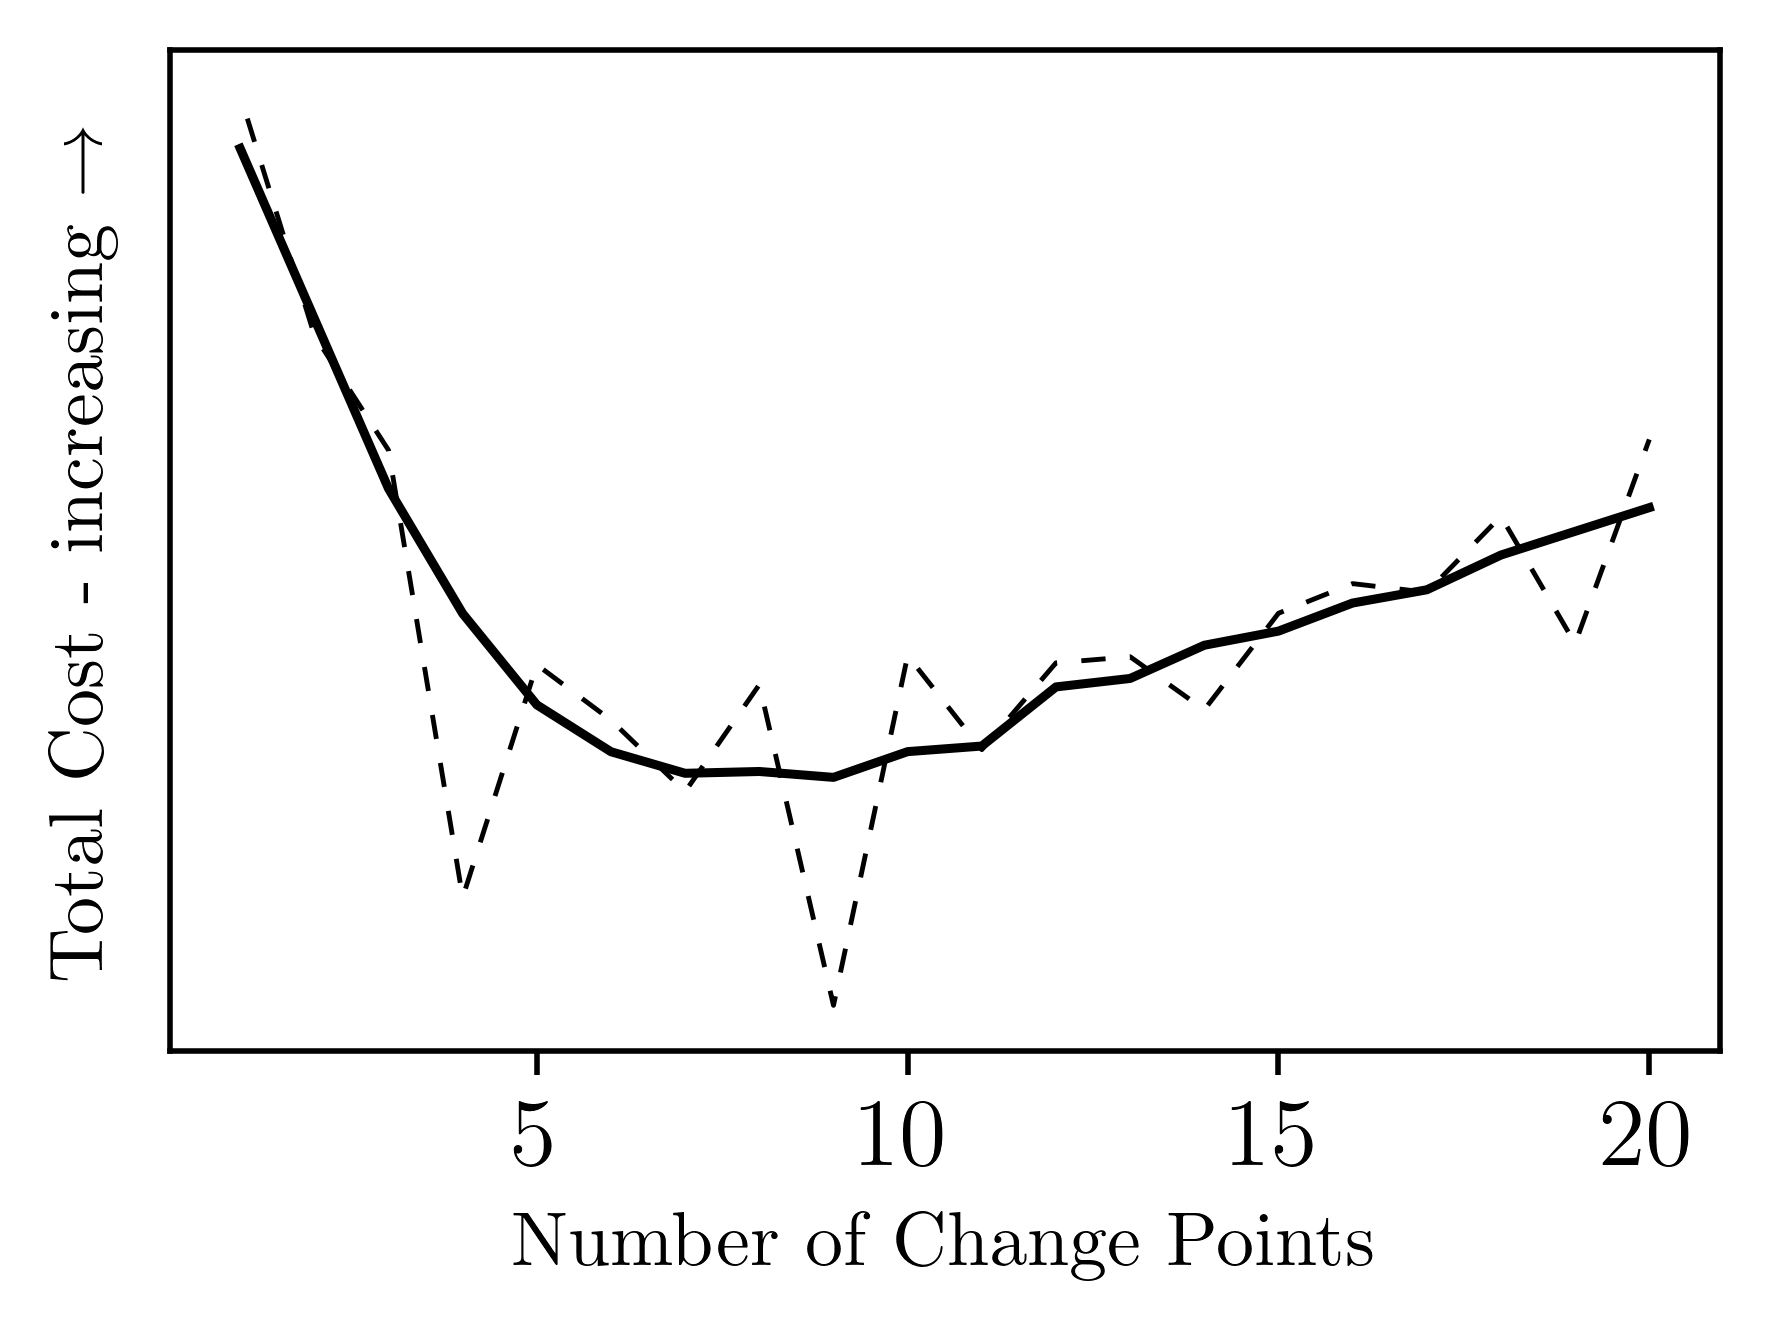
Model complexity —number of change points— impacts total cost The example illustrates how a penalty term discourages overfitting. Initial drop: Adding change points improves fit (lower SSE). Minimum point: The optimal balance between fit and complexity. Rising tail: Beyond this, the penalty outweighs SSE reduction, increasing total cost. This exemplifies the bias–variance trade-off: balancing accuracy with simplicity in model selection.
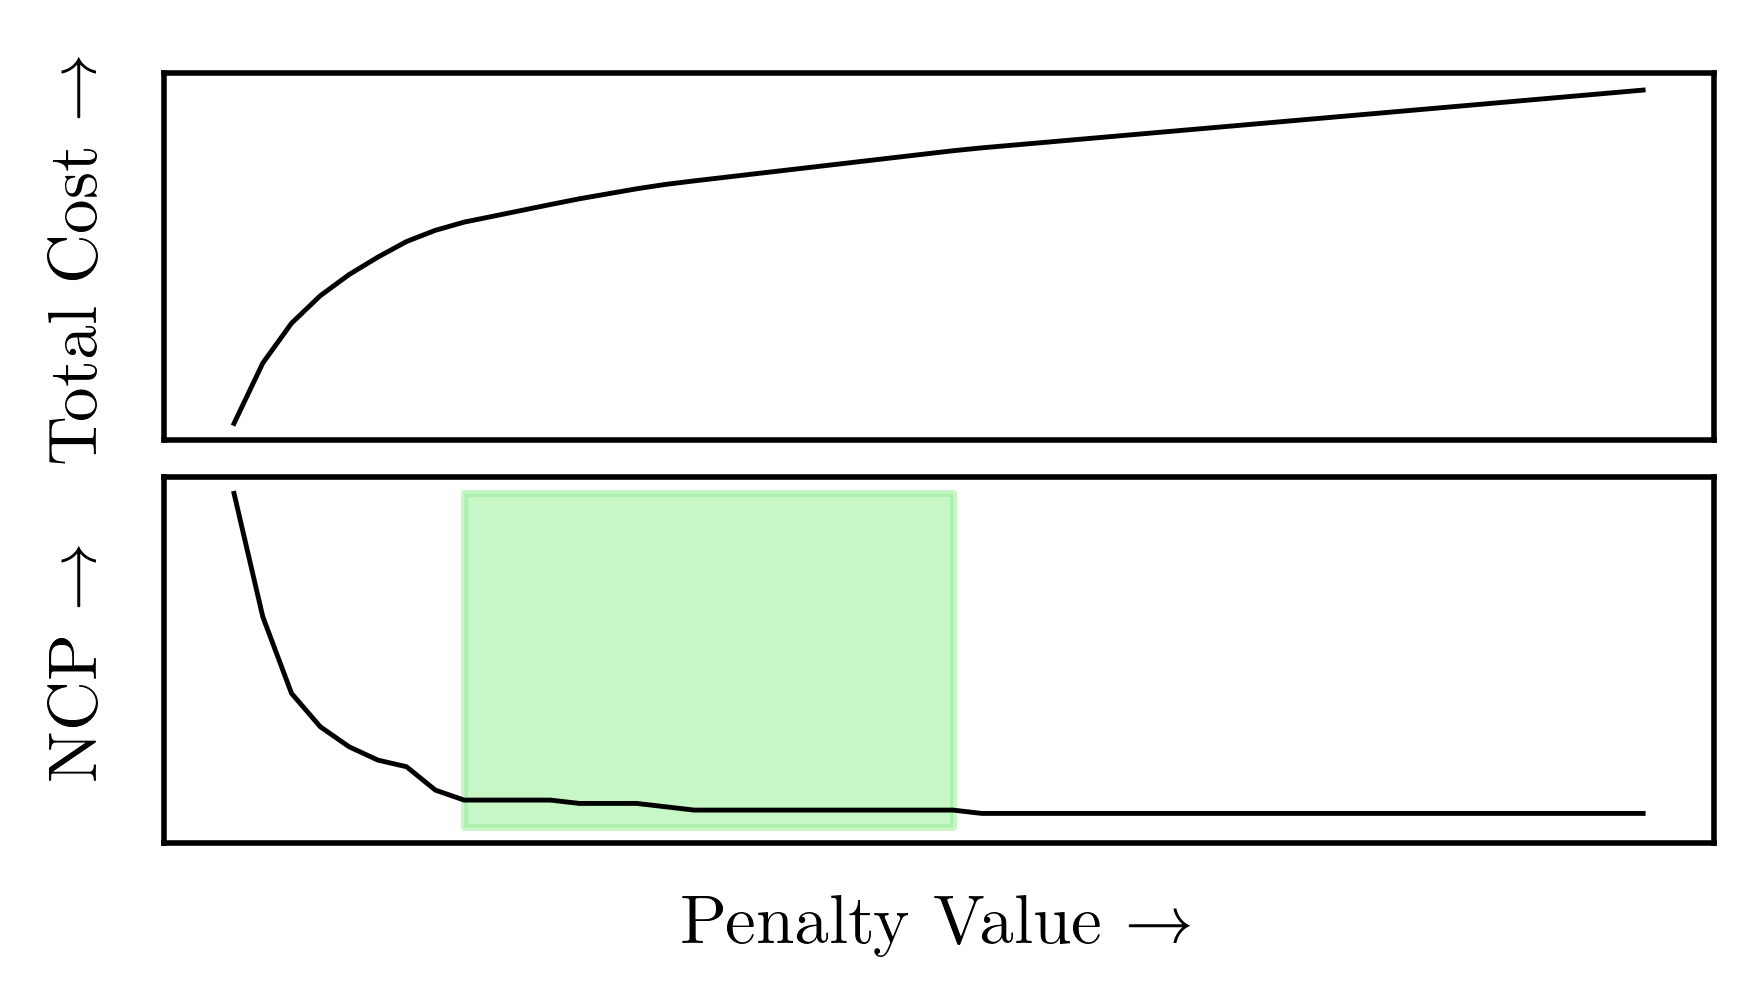
Penalty vs Number of Change Points. PELT balances model fit and complexity when detecting change points by varying the penalty parameter. Total Cost: A combination of sum of squared errors (SSE) within segments and the penalty for adding change points. Number of Change Points (NCP) are the times the algorithm splits the signal. The image shows some characteristics. The model favors fewer change points as the penalty increases which in turn reduce complexity. The steep drop: the model is sensitive and detects many changes—even noise at low penalties. Elbow point: A sharp bend where the number of change points stabilizes. This often indicates a good penalty value. Flat tail: At high penalties, the model becomes conservative and only detects major shifts. A higher penalty means PELT is more conservative—it avoids adding change points unless the fit improves significantly. A lower penalty makes it more permissive, allowing more change points even for small improvements. The green region is the sweet spot where the trade-off between fit and simplicity is optimal — capturing meaningful changes without overfitting noise. This justifies the choice of penalty when applying PELT to real-world data.
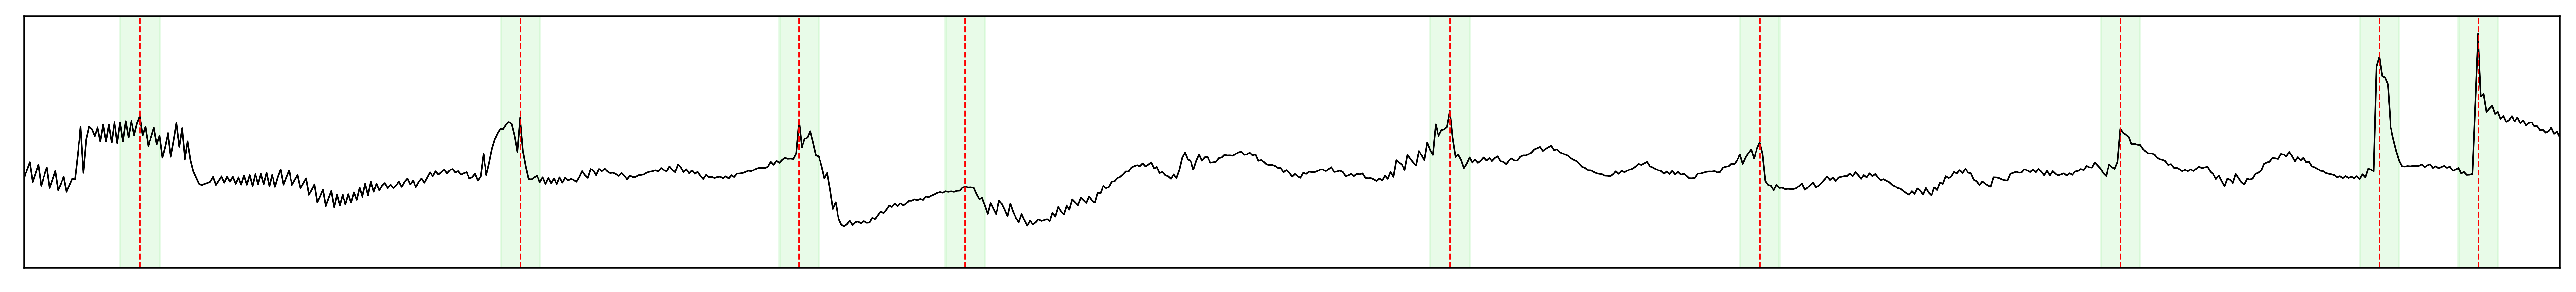
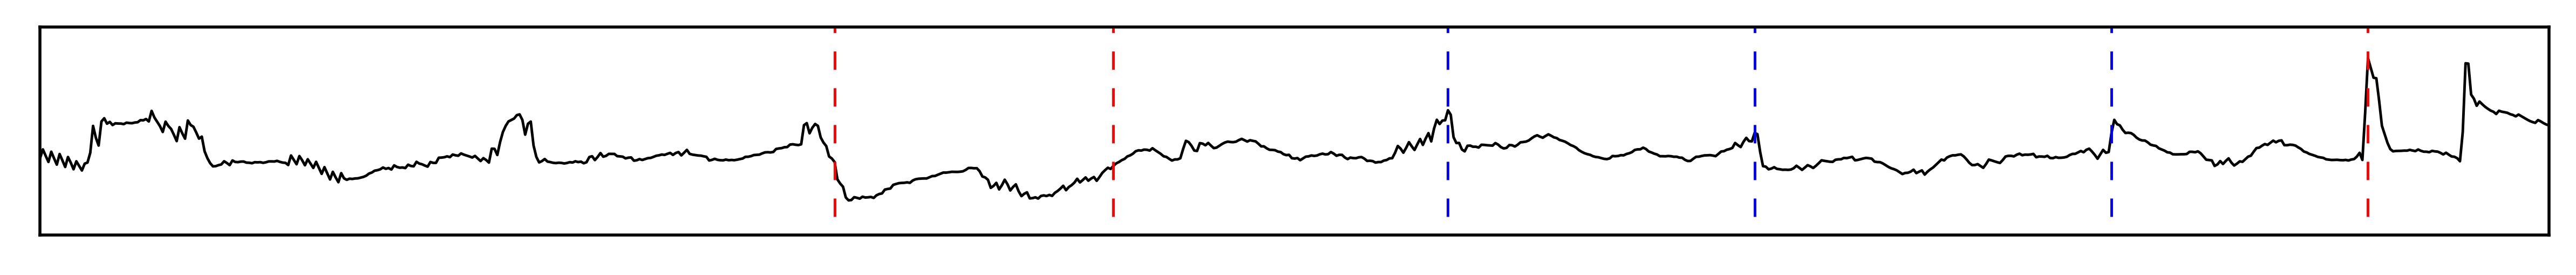
Limitations PELT might not be your best ally for cases with narrow, sharp triangular peaks. These aren’t level shifts; they’re transient, localized anomalies. In such cases, methods tailed to pinpoint short-lived disruptions rather than sustained changes are the way to go. The image shows PELT stturgling to detect those features. The narrow asymmetric peaks can represent cracks or anomalies.The red dashed lines are the algorithm results, and the blue dashed lines are irregularities not detected by the algorithm.
When signal features are sharp, brief, and localized—like spikes, cracks, or sudden bursts—traditional changepoint methods fail. In these cases, local maximum detection offers a more suitable alternative. This approach identifies points in the signal that stand out as local peaks by comparing each value to its immediate neighbors and evaluating characteristics such as height, prominence, width, and spacing. It is particularly useful for detecting transient anomalies that don’t significantly alter the overall mean but still carry important structural information.